0.2–0.5°C
The temperature rise caused by progesterone after ovulation — detectable only with a precision BBT thermometer
3 cycles
Typical time needed before your personal pattern becomes reliable enough for forward-looking prediction
Same time ±30 min
Required accuracy for consistent readings — temperature rises ~0.1°C for every extra hour of sleep
In this article
- What is BBT and why does it change?
- What you need to start
- How to take your BBT correctly — step by step
- How to read a BBT chart — the biphasic pattern
- The cover line method — confirming ovulation
- 4 BBT chart patterns and what they mean
- What your BBT chart reveals beyond ovulation
- BBT vs OPK vs cervical mucus — how they work together
- 6 mistakes that ruin BBT accuracy
- Frequently asked questions
What Is BBT and Why Does It Change?
Basal body temperature (BBT) is your body's lowest resting temperature — the temperature your body maintains at complete rest, measured first thing in the morning before any physical activity, eating, or even getting out of bed.
Throughout your cycle, BBT is influenced by hormones:
- Before ovulation (follicular phase): Estrogen keeps BBT relatively low — typically 36.1–36.4°C (97.0–97.5°F) for most women, though this varies.
- After ovulation (luteal phase): The corpus luteum (the empty follicle left behind after egg release) produces progesterone. Progesterone raises your core temperature by 0.2–0.5°C (0.4–1.0°F) and keeps it elevated for the rest of the luteal phase — until your next period or, if pregnant, even further.
This creates what is called a biphasic pattern — two distinct temperature levels: lower before ovulation and consistently higher after. The shift from low to high is the key event your BBT chart is designed to capture.
Important limitation: BBT tells you that ovulation has already happened — not that it is about to happen. The temperature rise occurs 12–24 hours after egg release, when the fertile window is already closing. BBT is most powerful as a pattern-building tool over multiple cycles, not a same-cycle predictor.
What You Need to Start
- A BBT thermometer — reads to two decimal places (e.g., 36.54°C). Standard oral thermometers only read to 36.5°C, which is too imprecise to detect a 0.2°C shift. BBT thermometers cost £8–20 and are widely available. Femometer, iBasal, and Fairhaven BBT Thermometer are popular options.
- A charting method — a period tracker app that supports BBT logging (Wamiga, Fertility Friend, Kindara), or a paper chart. Apps are strongly preferred as they draw the line, mark anomalies, and calculate the cover line automatically.
- A consistent sleep schedule — ideally at least 3 hours of uninterrupted sleep before taking your temperature. Shift work, late nights, and disrupted sleep will produce unreliable readings.
- A bedside habit — keep the thermometer on your nightstand and measure before you sit up, speak, drink, or even reach for your phone.
How to Take Your BBT Correctly — Step by Step
1
Set an alarm for the same time every morning — within a 30-minute window
For every extra hour of sleep beyond your usual time, BBT rises approximately 0.1°C. Sleeping in on weekends will give falsely elevated readings. Set a consistent alarm — even on days off — and take your temperature before doing anything else. A 30-minute window either side is acceptable.
2
Take your temperature before any movement, speech, or drink
Physical activity, sitting up, talking, and drinking all raise body temperature. The thermometer should go in your mouth (or vaginally — more accurate) before you move a muscle. Keep the thermometer bedside so you do not need to get up to retrieve it.
3
Hold the thermometer under your tongue for the full beep cycle
For oral BBT: place the tip under your tongue and keep your mouth closed. Do not breathe through your mouth. Most BBT thermometers take 60–90 seconds and beep when ready. Do not remove early — even 10 seconds short gives a falsely low reading.
4
Record the reading immediately — to two decimal places
Log the exact reading before you do anything else — many BBT thermometers store the last reading in memory so you can check it after getting up, but note it down while still in bed to prevent forgetting. Record which day of your cycle it is and any notes: illness, alcohol, late night, stress, unusual sleep.
5
Note any disturbances on your chart — don't discard the data point
If you had a late night, illness, alcohol the evening before, or a fever, mark the reading on your chart as "disturbed" but still record it. Deleting data points creates gaps that make the biphasic pattern harder to read. Most charting apps allow you to flag individual readings as unreliable so the algorithm ignores them in its calculations.
How to Read a BBT Chart — The Biphasic Pattern
A typical BBT chart across a 28-day cycle shows two distinct phases — lower temperatures before ovulation and higher temperatures after. Here is what that pattern looks like:
Typical Biphasic BBT Chart — 28-Day Cycle
Temperature range: 36.0–37.0°C | Cover line at 36.5°C
Cover line: 36.5°C
1
2
3
4
5
6
7
8
9
10
11
12
13
14★
15
16
17
18
19
20
21
22
23
24
25
26
27
28
Pre-ovulation (low phase)
Ovulation day ★
Post-ovulation (high phase)
Cover line (36.5°C)
← Scroll to see full chart → ★ = Ovulation confirmed on Day 14
Key features of a healthy biphasic chart:
- Low phase: Temperatures cluster in a relatively narrow range — typically 36.1–36.4°C (97.0–97.5°F) for most women. Your personal range will differ.
- The shift: A clear rise — often preceded by a slight dip the day before — marking ovulation. Three consecutive temperatures above the cover line confirm ovulation.
- High phase: Elevated temps held steadily for 12–14 days, then dropping at menstruation (unless pregnant, in which case they stay high).
The Cover Line Method — Confirming Ovulation
The cover line is a horizontal reference line drawn on your BBT chart to identify when your temperature has definitively shifted into the post-ovulation high phase. Here is how to calculate it:
- Look at the last 6 temperatures before the suspected shift.
- Find the highest of those 6 temperatures.
- Draw a horizontal line 0.1°C above that highest temperature. This is your cover line.
- Ovulation is confirmed when you have 3 consecutive temperatures above the cover line.
Example: Your last 6 pre-shift temps are 36.2, 36.3, 36.25, 36.3, 36.2, 36.35. Highest = 36.35. Cover line = 36.35 + 0.1 = 36.45°C. Your next 3 days read 36.6, 36.65, 36.7 — all above 36.45. Ovulation confirmed. Most BBT apps calculate this automatically.
4 BBT Chart Patterns and What They Mean
Classic Biphasic
Clear low phase → pre-ovulation dip → sustained high phase. This is the textbook healthy pattern confirming regular ovulation.
Normal ✓Monophasic (Flat)
No clear temperature shift — temperatures stay flat throughout the cycle. Suggests possible anovulation (no egg released). Occasional flat cycles are normal; consistent monophasic charts need medical review.
Needs review if consistentShort Luteal Phase
Temperature rises confirm ovulation, but the high phase lasts fewer than 10 days before dropping. A short luteal phase (<10 days) can make implantation difficult and may be associated with luteal phase defect or low progesterone.
May need investigationTriphasic Pattern
A second temperature rise occurs during the luteal phase — creating a third level. This is sometimes associated with early pregnancy (rising hCG adds to the progesterone effect), but is not diagnostic. Take a pregnancy test if your period is due.
Possible early pregnancy signWhat Your BBT Chart Reveals Beyond Ovulation
A completed BBT chart is a rich source of cycle health information — far beyond just confirming ovulation:
Your personal ovulation day
After 2–3 cycles of charting, you will see your personal ovulation pattern. Most women ovulate consistently within a 2–3 day range each cycle, even if their overall cycle length varies. This makes future fertile window prediction much more accurate than calendar math alone.
Your luteal phase length
The number of days between ovulation (temperature shift) and your next period is your luteal phase. A healthy luteal phase is 12–16 days. Consistently fewer than 10 days may indicate low progesterone or a luteal phase defect — useful clinical information to bring to your doctor.
Whether you are actually ovulating
For women with irregular cycles, PCOS, or who have recently stopped hormonal contraception, BBT charting is one of the simplest ways to check whether ovulation is occurring at all. A consistently monophasic chart (no temperature rise) suggests anovulation — worth investigating.
An early indicator of possible pregnancy
If your temperatures remain elevated for 18 or more days after your confirmed ovulation — or show a triphasic pattern — without your period arriving, that is a strong early sign of pregnancy. Take a pregnancy test to confirm.
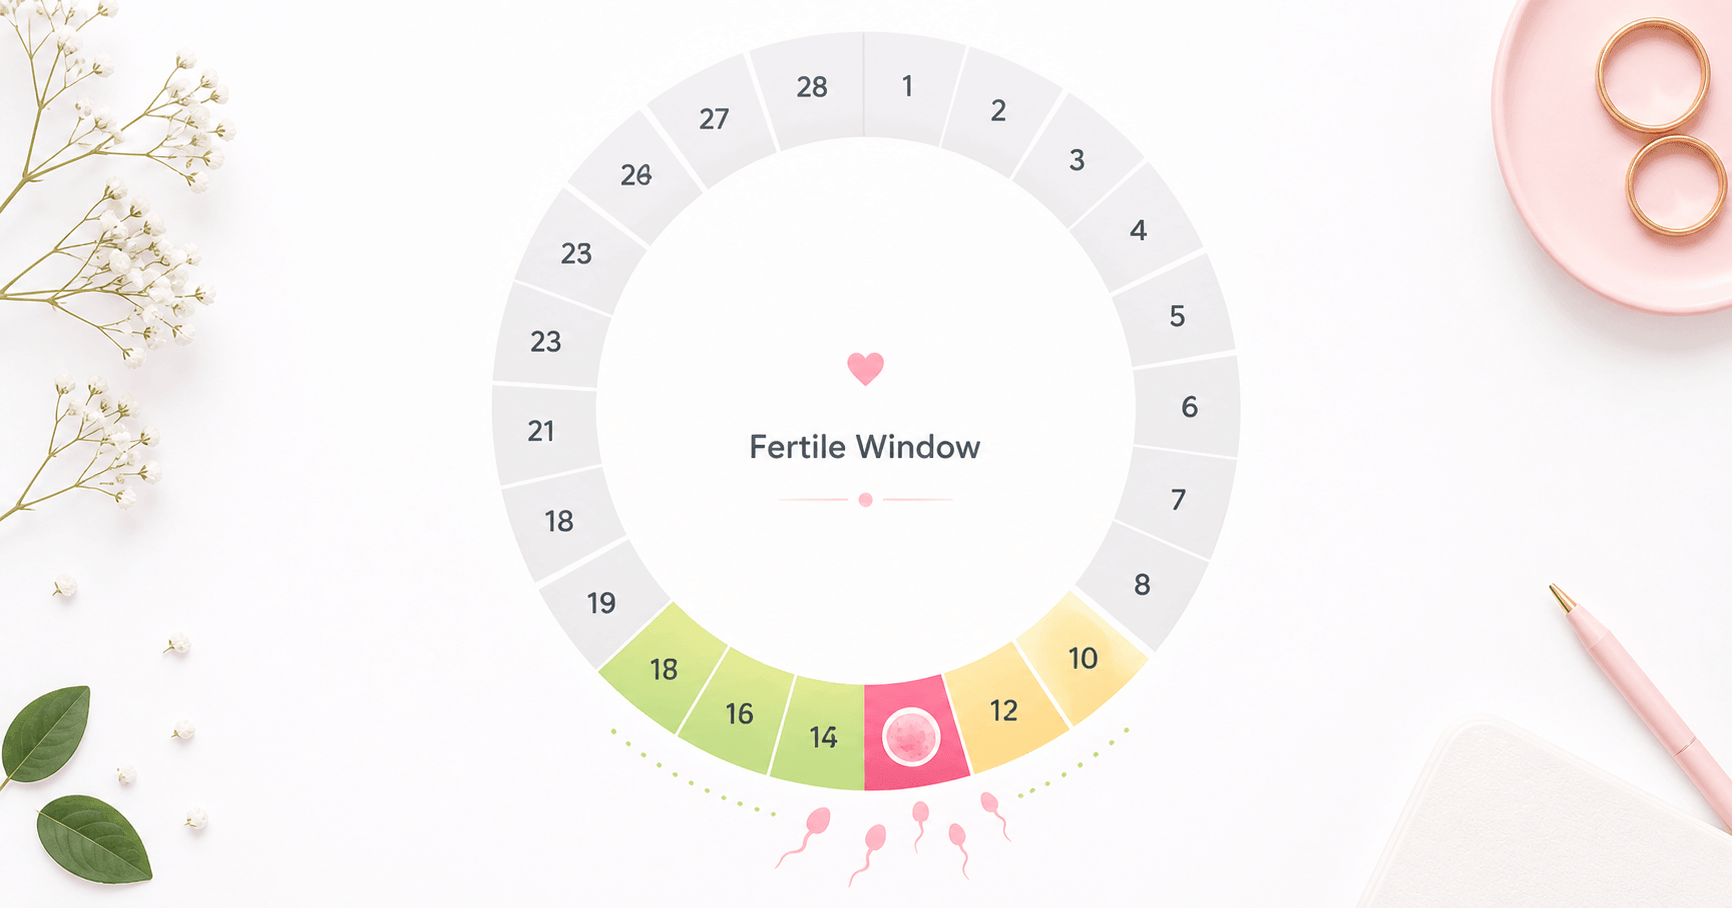
BBT vs OPK vs Cervical Mucus — How They Work Together
Each fertility sign provides different information at different points in your cycle. Using all three together gives you the most complete picture:
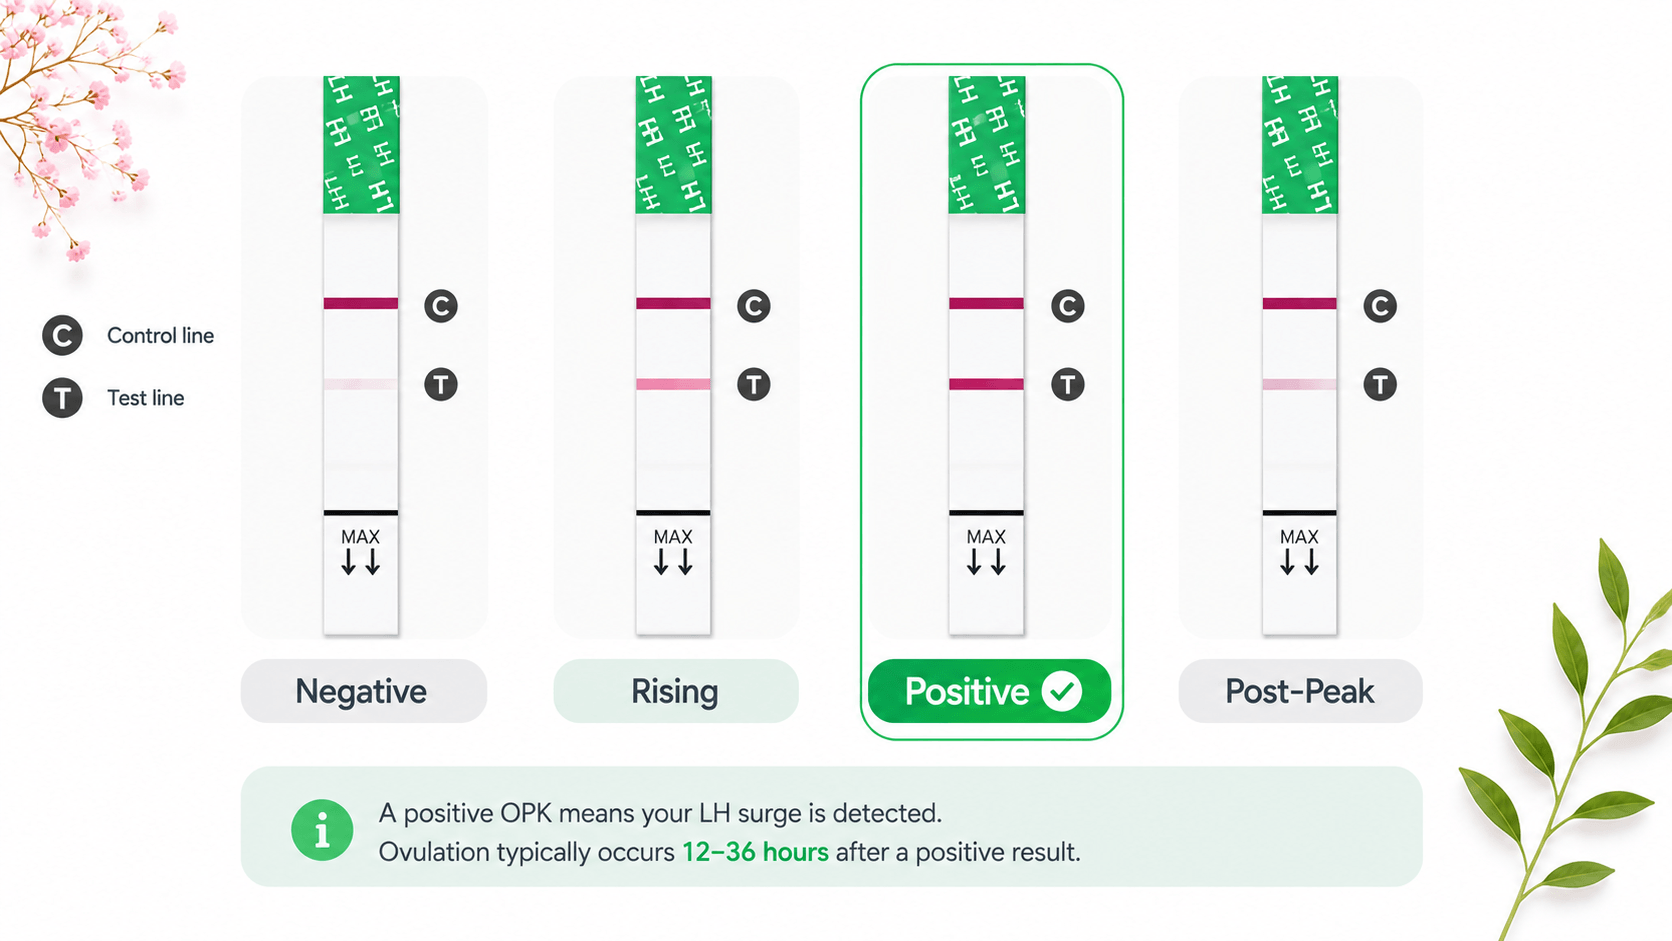
OPK Strips
Detects LH surge 24–36 hours before ovulation. Action signal — tells you to have sex now.
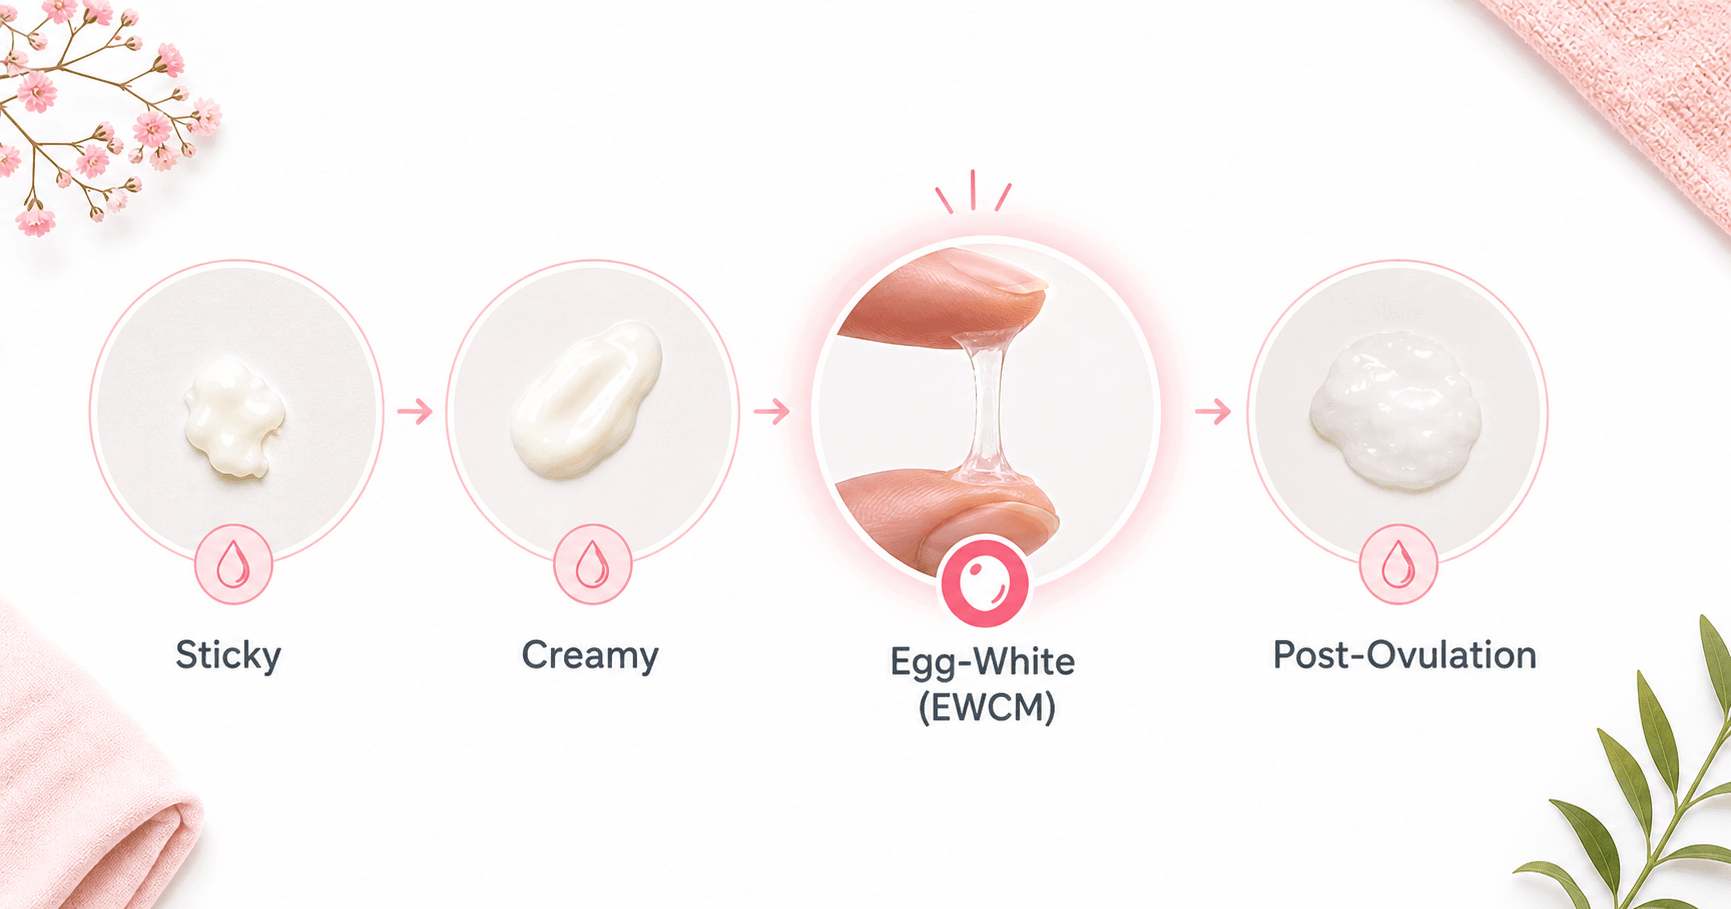
Predicts ovulation ✓Cervical Mucus
EWCM (egg-white mucus) appears in the 3–5 days before ovulation. Opens the window — tells you fertility is rising.
Window opening ✓BBT
Temperature rises 12–24 hours after ovulation. Confirmation signal — tells you ovulation occurred and window is now closed.
Confirms ovulation ✓The Symptothermal Method combines all three — cervical mucus to open the fertile window, OPKs to pinpoint the peak, and BBT to confirm ovulation. Over 2–3 cycles, your accumulated BBT data also starts predicting your future ovulation day, complementing the OPK real-time detection.
Wamiga integrates all three fertility signs — log your BBT reading, OPK result, and cervical mucus each day. The AI builds your personal cycle pattern over time, predicts your fertile window earlier with each cycle, and sends a notification when you're in your peak days. Try Wamiga free →
6 Mistakes That Ruin BBT Accuracy
Using a standard thermometer
Regular oral thermometers read to one decimal place (e.g., 36.5°C). The ovulation shift is 0.2°C — impossible to reliably detect with that precision. You need a BBT thermometer reading to 0.01°C.
Fix: Buy a BBT-specific thermometer (£8–20)Taking temperature after getting up
Any physical activity — including sitting up, walking to the bathroom, or retrieving your thermometer from across the room — raises your temperature and invalidates the reading. Thermometer must be within arm's reach.
Fix: Keep thermometer on your nightstandInconsistent testing time
Temperature rises ~0.1°C per extra hour of sleep. Testing at 6 am weekdays and 9 am weekends creates a pattern that looks like a "shift" that isn't one. Set a consistent alarm every day.
Fix: Same time daily — within 30 minutesDiscarding disturbed readings
Illness, alcohol, late nights, and travel all affect BBT. The correct approach is to flag these readings as disturbed (most apps have this feature), not delete them. Gaps make the chart unreadable.
Fix: Log with a "disturbed" flag — never deleteGiving up after one "weird" cycle
The first cycle is always the hardest to read — you do not yet know your personal baseline. Charts become significantly clearer from cycle 2 onward, and reliably predictive by cycle 3. Commit to at least 3 months.
Fix: Chart for at least 3 full cyclesNot logging notes with each reading
A single outlier temperature (spike, dip) can look alarming without context. Logging notes — "had two glasses of wine," "slept only 4 hours," "early alarm, back to sleep for 2 hours" — explains anomalies and keeps your chart interpretable.
Fix: Add a brief note with every flagged readingSources & Further Reading
The guidance in this article is informed by reputable medical and public-health organizations:
Frequently Asked Questions
What is basal body temperature and why does it change?
Basal body temperature is your body's lowest resting temperature, measured first thing on waking before any movement, eating, or drinking. After ovulation, the hormone progesterone causes your BBT to rise by 0.2–0.5°C and stay elevated for the rest of the luteal phase. This sustained shift is the indicator that ovulation has occurred.
Can BBT predict ovulation before it happens?
No — BBT confirms ovulation after it has already happened. The temperature rise is caused by progesterone, which only rises after the egg has been released. BBT is most powerful as a retrospective pattern-building tool over 2–3 cycles, which then enables more accurate prediction of future cycles when combined with OPKs and cervical mucus observations.
Do I need a special BBT thermometer?
Yes. A standard oral thermometer only reads to one decimal place (e.g., 36.5°C), which is too imprecise to detect a 0.2°C ovulation shift. You need a BBT thermometer that reads to two decimal places (e.g., 36.54°C). These are inexpensive — around £8–20 — and widely available online and in pharmacies.
What does a triphasic BBT chart mean?
A triphasic pattern occurs when BBT rises a second time during the luteal phase — creating three temperature levels instead of two. This pattern is sometimes associated with early pregnancy, as rising hCG can cause an additional temperature increase on top of progesterone. However, it is not diagnostic — take a pregnancy test to confirm if your period is due.
What does it mean if my BBT never rises?
A flat or monophasic BBT chart — no clear sustained temperature rise — suggests that ovulation may not have occurred in that cycle. An occasional anovulatory cycle is completely normal. If you have consistently flat charts across multiple cycles, speak to your doctor as it may indicate PCOS, a thyroid condition, or another hormonal imbalance worth investigating.